I have noticed in the Liverty Converse version 5.4.3 there isn’t a report that breaks down the actula time agents are on a specific interaction, is this others experience?
Hi @LynseyLeonard and welcome to the community,
I have taken a look at the Interaction report and this shows me the following:
-
Queue Time - How long the interaction was queuing for before being answered/abandoned/redirected
-
Duration - How long the interaction was with the Agent
-
Talk Time - Breaking down the Duration with how much time the Agent was “talking” with the customer
-
Hold time - Part of the Duration but shows how much of this time caller was placed on hold by the Agent.
So you can have a duration of 00:03:56 with a talk time of 00:2:56 and a hold time of 00:01:00 that could be the breakdown of this.
This data helps you break down each individual interaction and by using a program like Excel you can use the data within these to further customise your report to give you a breakdown of your particular needs by agent/activity code and all sorts.
The Agent Summary report although does not show an exact handling time per interaction it does show you the agents average handling time as a global calculation of the media type and time you have selected.
Does this help? If not do let us know, if you have an example of what you are trying to achieve then please post this and we can take a look.
Many thanks - Jonathan Redsell
1 Like
Thank you for this, we hope that there is the potential for improvement in this area so excel won’t be necessary to calculate the total time.
Hi Lynsey, do you have an example of what it is you are looking to do as it may be another report displays what it is you are looking to do.
Hi Jonathon, Thank you for this, do you know if the Agent Status Breakdown report includes all media all interactions for all media, please. When a colleague is running an interactions report and comparing it to the Agent Status Breakdown there is a difference. What we are attempting to do is calculate what our Connect Centre considers to be wastage time.
Hi @LynseyLeonard I have dropped you a message with my contact details. Perhaps we can arrange a Teams call to go through your questions and hopefully I can provide some answers.
Look forward to hearing from you.
Jonathan.
Thanks Jonathon, what we have now established is the interactions report differs to the Agent Summary because internal interactions advisor to advisor times are not included. We are in the process of putting a Service request to Netcall for an improvement in this reporting. Thank you very much for your help and guidance.
Thank you @LynseyLeonard for you and your teams time yesterday to look onto the reporting data that is important for you.
For anyone one else interested we took a look at a couple of question in relation to reports and what ones to run to pull out the required data.
The first question was about the number of calls within a Queue and how to differentiate those that are direct and those that were transferred in from another Contact Centre Queue. Within the Queue Summary Report you can add (using the Configure Columns option) to add the Direct Calls Queued and Transferred Calls Queued columns (like this)
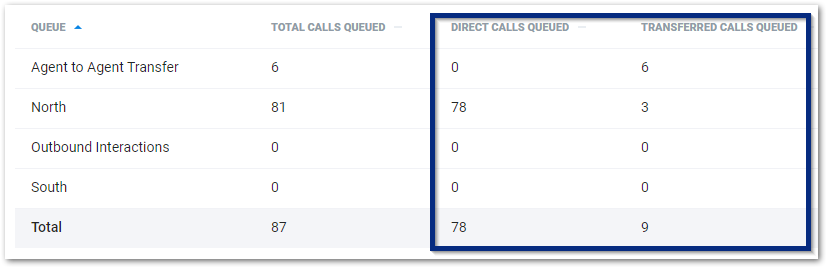
As you can see adding these columns to your report can provide more meaning to your Queued calls.
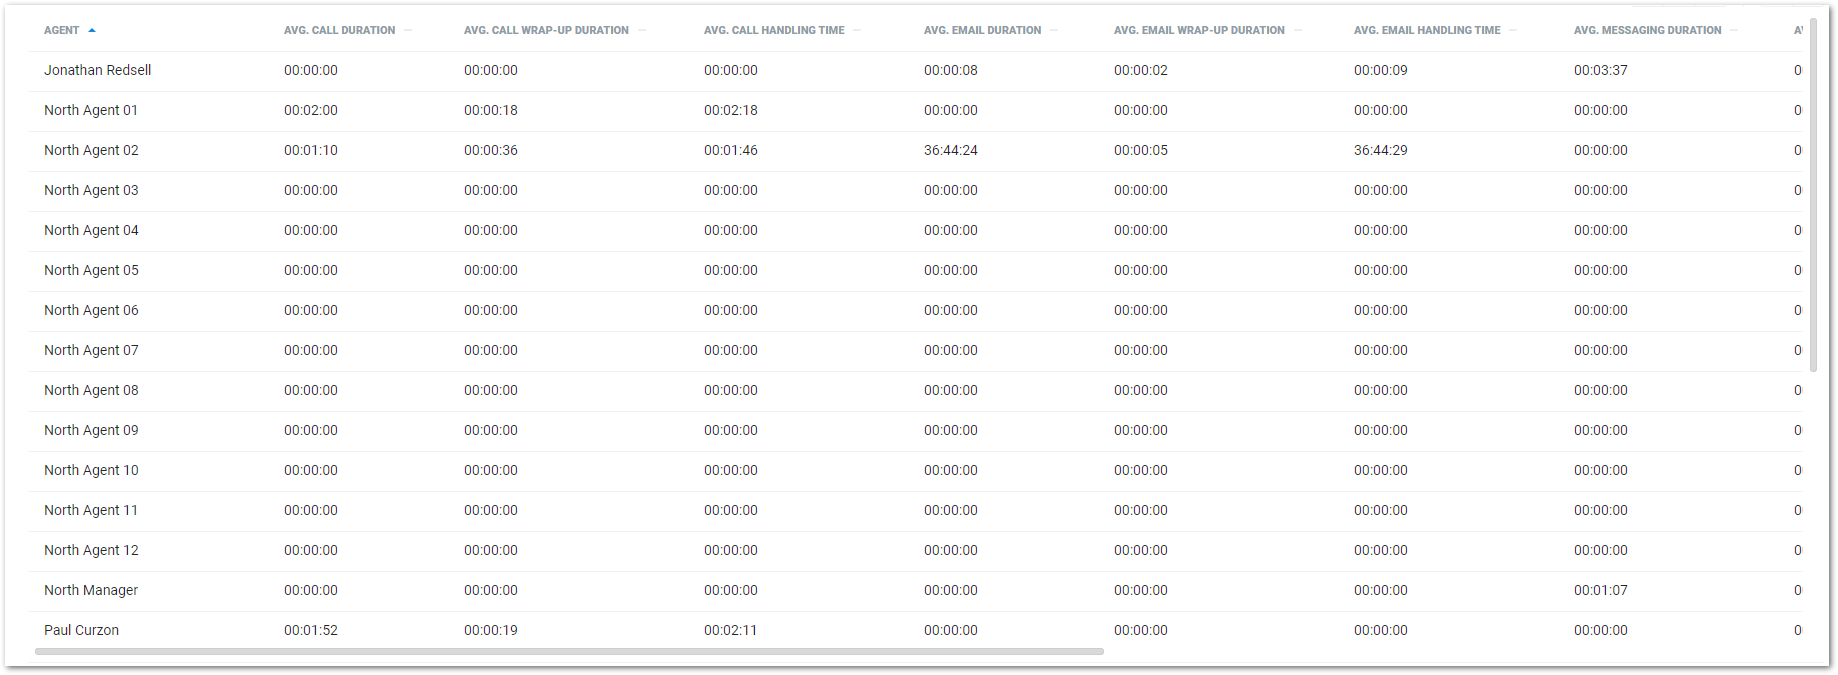
Another item discussed as how can you see the average time an Agent spends dealing with an Interaction. This is found in the Agent Summary Report. The Agent Summary report can display the Average Handling Time, the Average Duration and the Average Wrap up time of each Agent across each Interaction type like so:
We then came on to looking at the Calls Answered vs Abandoned within certain time periods. This of course comes to everyone’s SLA, but also some customers don’t use a Time period but the Abandon Rate and some use both.
I recommend that customers setup their SLA per Queue to ensure each Queue is reportable. Of course if they are all the same then you can use the Group but I still feel having it on a Queue level just enables more flexibility long term. The SLA works on a percentage of calls answered within x seconds and this is set up within your Group Supervisor Settings.
You can also use the Queue Time Analyse Report to look at calls that were answered and abandoned within 5 second increments. This is really handy to see those calls who hung up within 5 seconds of entering the Queue - Note Converse doesn’t include calls with a extremely short queue time & abandoned within the SLA figure so using this report will help you see the total calls and their times that they abandoned if this is a figure that is important to you.
@LynseyLeonard We are taking a look at the SLA count issue you noticed on your system and trying to replicate it but if you can provide some exports of this and send it over to me then we can take a look as currently I haven’t been able to replicate the same experience on my system.
Hope this bit of information has helped others and don’t forget you can use the Help icon within your Liberty Converse system and also use the Documents tab within the Community to view the Help and read up on all the reports/columns and their meanings held within Liberty Converse. Of course if anyone has any questions on reports then do get in touch.