Hi all,
I’ve built a Code Studio widget that shows your organisation as an interactive org chart. Add it to a User page and it shows that person and everyone who reports to them, with links to your own pages and Microsoft Teams chat, call and meeting buttons on every person. I’m happy to share it with anyone who wants it.
Google Stacked
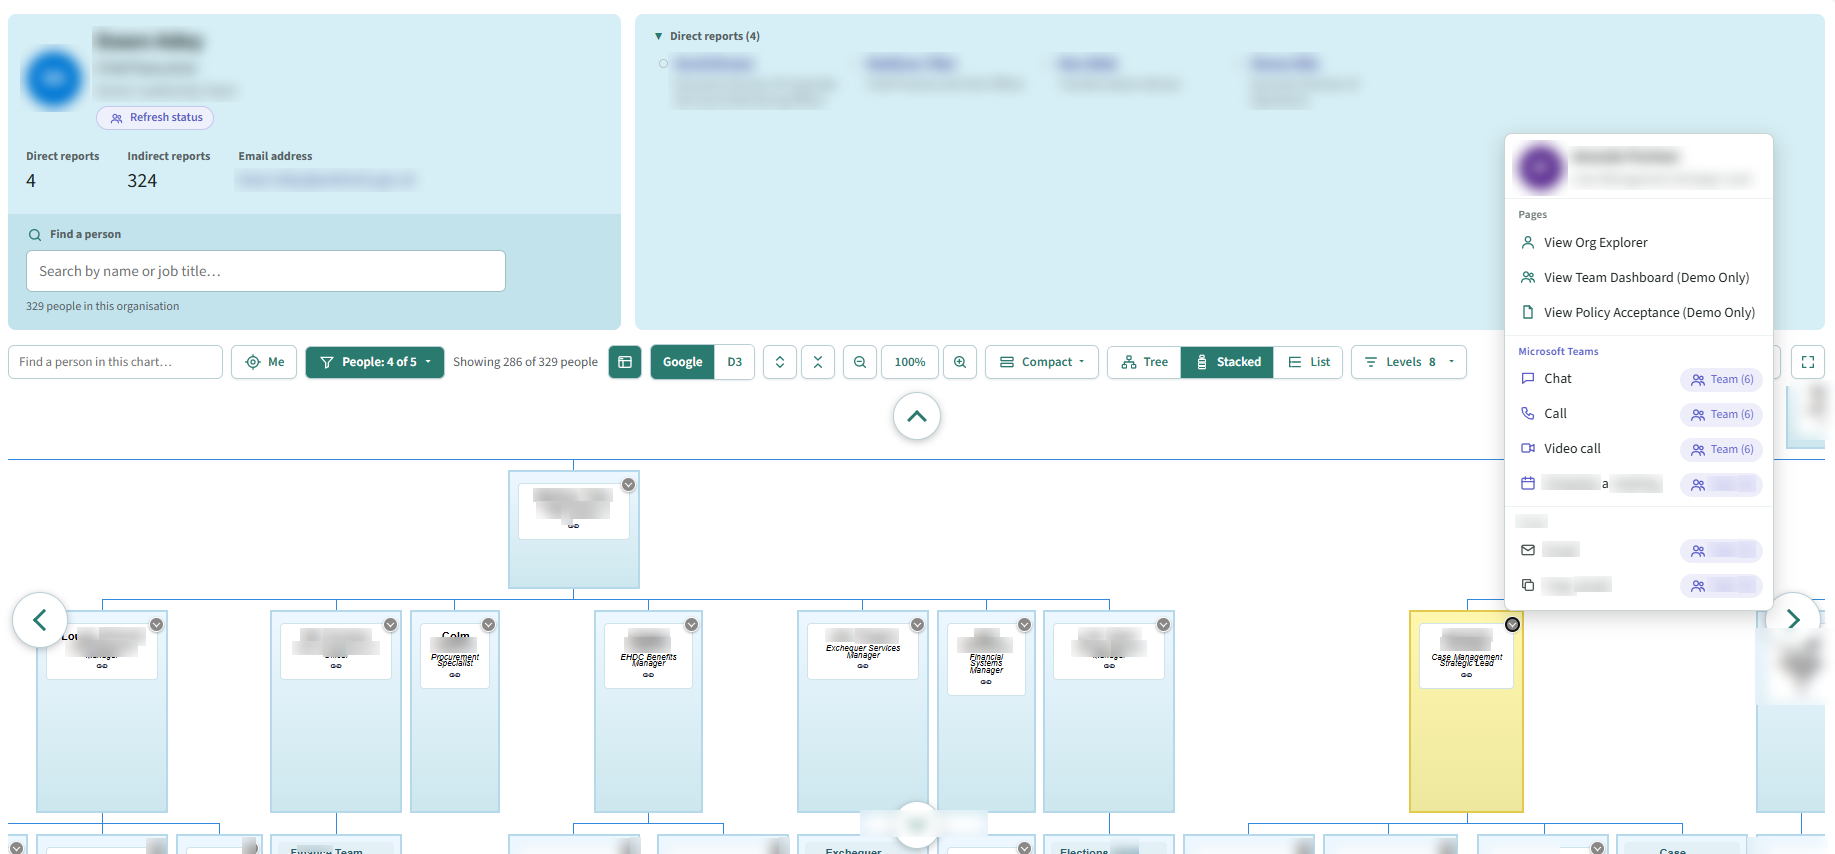
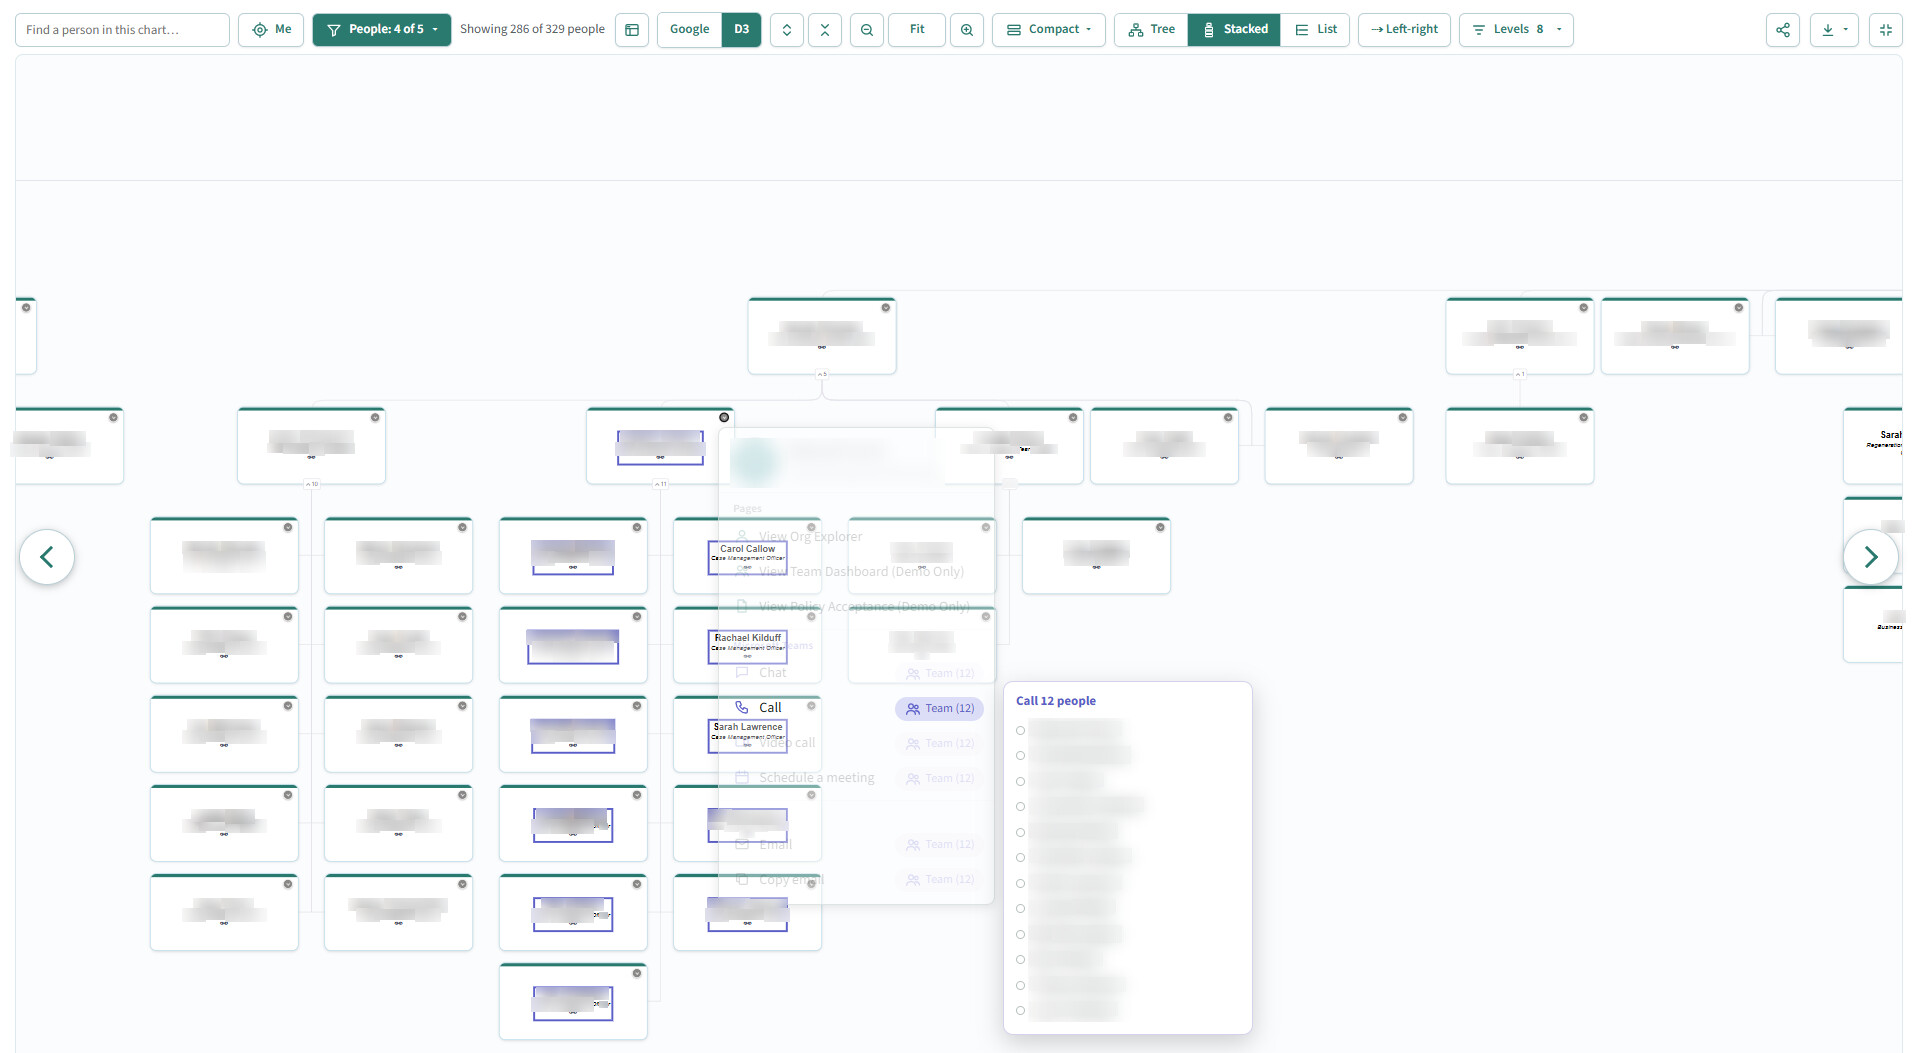
D3 Stacked Fullscreen
What it does
- Draws the chart from any User down the management line, as many levels as you allow
- Two chart engines with the same settings: Google Charts (boxes in rows) or D3 (cards you can drag and zoom). Users switch with one click
- Shows name, job title, team and photo on each tile, with the logged-in user’s tile highlighted
- Has a navigator panel above the chart with the person’s manager, peers, direct reports, a “Reports to” breadcrumb and a people search
- Opens an actions menu on each tile (right-click, the corner badge, or long-press on touch screens) with:
- links to up to 6 of your own pages
- Teams chat, call, video call and meeting
- email and copy email
- Teams status and out-of-office, if you store them on the User
- Team actions for managers: one click starts a group chat, call, meeting or email with their whole team
- Toolbar: Find in chart, “Me”, expand / collapse all, zoom, compact mode, a People filter by user type (e.g. hide Councillors) and a Levels drop-down
- Share links that reopen the chart exactly as you see it
- Downloads as an image, a print / PDF, or a spreadsheet (CSV), which can be imported into Visio’s org chart wizard
- Full screen mode
How it works
main.js follows one relationship from a User to the people they manage (e.g. Users (Managed)), and optionally the reverse Manager relationship for the navigator panel. Everything else is optional field mappings in the widget settings, so it should fit most User object set-ups.
The Teams actions use Microsoft’s standard deep links by email address, so there’s no Teams or Graph set-up in Liberty. Status and out-of-office are read from fields on the User. The widget doesn’t fetch them itself, so they’re only as up to date as however your app keeps those fields current.
The chart engines load from Google (gstatic.com) and public CDNs (cdnjs and jsdelivr), so users’ browsers need to reach those.
Firewall And Access Profiles - Interface
Add these domains if used to your
- https://cdnjs.cloudflare.com/ == ORG CHART 3.8 - for image creation
- https://www.gstatic.com/ == ORG CHART - for charts
- https://cdn.jsdelivr.net/ == D3 Org Chart
Requirements
- Liberty Create 2025.3 (tested on 2025.3.858)
- Code Studio access to import a component
- A User object with a manager / managed relationship
What you get
- The component export (zip) to import into Code Studio
- An 18-page guide covering set-up, the data model, every setting with its default, and troubleshooting
The Files
I’ve submitted this as a Widget on App Share. In the meantime, if you want a copy, DM me and I’ll email you the code and the guide.
It shows staff names, job titles, photos and Teams status, so put it on pages only signed-in staff can see.
Feedback and ideas welcome. If you find a bug, reply here and I’ll take a look.
Jonathan Fleury-Smith
East Hampshire District Council