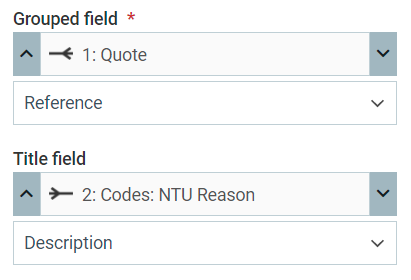
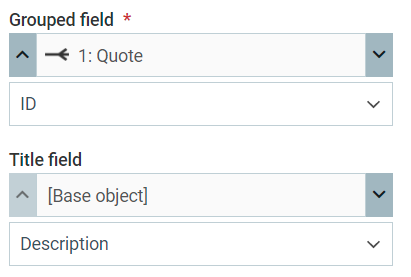
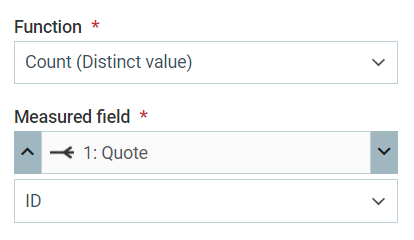
lets say I have 2 simple objects - Quote and Reason … they are a Many (Quote) to One (Reason) relationship.
I want to display a chart that shows the number (of quotes) for each reason code I have.
So far so good.
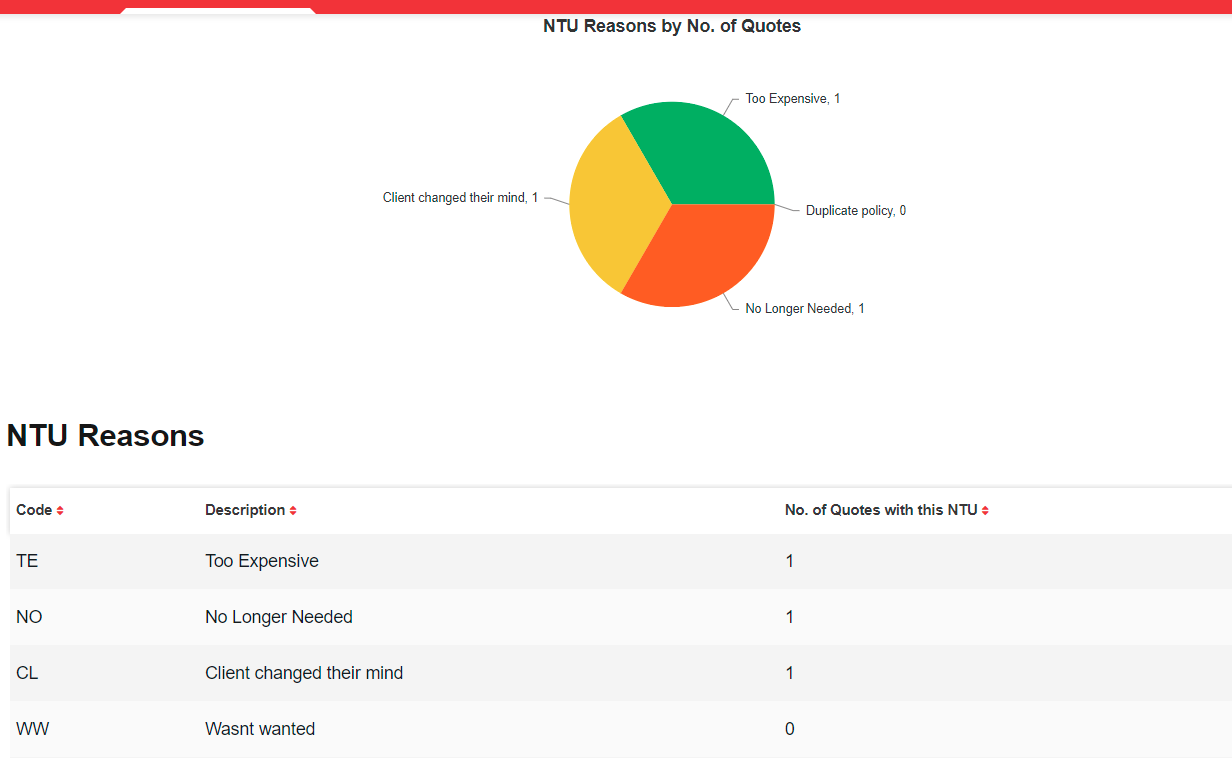
So the image shows 4 reason codes in the pie chart despite the fact that the table only has 3. The table is actually sorted by an aggregate (count) across the relationship above.
Why I am even seeing a 4th (0) value in my pie chart ?
Thanks
Haydn