Can I add and view related records using recursion

For instance I have a loosely defined hierarchy of people. A person records contains at least these properties: name, email, manager name, manager email.

I have a many to one relationship from this object to itself and that is used with a signal to relate people to their managers.

Q1. Can I use rules to create all the relationships between a single record and their decedents? (without knowing the depth of the search)

Q2. How would I create a list to show all the people at all levels below a manager?

Afternoon Craig,

What a fantastic question and the answer is a resounding yes.

To Answer Q1 :
What you would need to have is the employee id of a single line manager per employee in your user table pointing to a corresponding employee id for the manager. The next step would be to form a one to many relationship from the user object back to the user object labelling the one (parent / line manager) to many (child / report).

Next use a signal and a rule to form the relationship across this newly formed circular relationship based upon the matching of line manager id to employee id. This circular arrangement is a pre-requisite of my answer to Q2. The rule is 'Add Relationship by Matching’.

You would want a subset to exclude those who already have a relationship to a line manager for your signal, and you would want another rule to fire to form the relationship for new employees. You do not need to worry about the depth because you are relating every employee to their line manager not attempting to relate many line managers to their many employees.

To Answer Q2 :
Now that you have a circular relationship you can use our Tree Widget, starting at the child. The widget will then ask for the relationship to the parent. The widget should then display a tree of Line managers and Employees. If set as editable the widget will allow the relationships to be changed. Clicking can link you to the employee page.

Edit: @LewisGallagher has just brought to my attention that we also have a widget in AppShare that can display an Organisation Chart. Please let us know how you get on.

https://community.netcall.com/appshare/i/organisation-chart/

1 Like

Thanks @adam.mills and @LewisGallagher

Not quite, what I’m looking to do with this. This is great and I’ll find a use now that I know about these.

The feature I’m trying to deliver is for a manager(s) that have many sub teams below them.

Manager A
officer 1 reports to Manager A
Sub manager B reports to manager A
officer 3 reports to manager B
officer 4 reports to manager B
Sub manager C reports to manager A
officer 5 reports to manager C
officer 6 reports to manager C

I’d like to build a page where the Manager A can see at a glance some reporting metrics, e.g. number of assigned cases that each of those other people have.

Sorry Craig for that particular use case I would suggest a custom vue presenter.

Shouldn’t be that difficult to build a recursive lookup from the manager line and present the name alongside a case count.

Can somebody confirm if the Organisation Chart App Share Widget is working with 2024.2 as it’s throwing this error when I add to a page.
image

There is error thrown in code studio

cs.environment() is deprecated. Use cs.context().sphere instead

Unsure if this is related to issue, or if I’ve mis configured.

Thanks
JonathanFS

Hi Jonathan,

That error should come up as a runtime warning instead of an application error so may be a separate issue. That error does suggest the code base in the widget itself is out of date but maybe not the exact issue.

Could you check to see if you are getting any errors in your browser console by pressing F12 and reloading that page or check detective to see if any other errors are being produced by the system upon load?

It looks at though this widget loads javascript from https://www.gstatic.com, this will require this domain to be added to the firewall and access profile for interfaces. You may well see an error to this effect in the browser console too.

Hopefully this helps to start identify the issue.

Carl

Hi Carl

When the page loads I get the following console errors.

Can you provide some details of what I need to add to Security & Access Profile to enable this file to be loaded?

Thanks
JonathanFS

Hi Jonathan,

Yes my assumptions were correct it is a firewall issue with it being able to load the Google charts.

On your app, in Build studio go to Security > Firewall & Access Profiles (/b/firewall_profiles).

Edit your “Interface” profile (assuming this is the profile applied to the interface in question). On the “Domains” tab, you will need to add a new entry to “Domains that can contribute content to the liberty create application”. Add in https://www.gstatic.com. The options for this specific widget I am not 100% sure of so may be a bit of trial and error, you can go whole hog and tick everything but generally not recommended if you can avoid. I would personally start with JS as the selected option and build up until it is fully functional.

Carl

Hi Carl

Adding the script under Interfaces has meant the widget now works at runtime.

I am however still getting an error in Editor that I can’t pin down.

It appears to be only blocking the script in editor, not at runtime.
This is what appears in console when loading the page above in the editor.

Do I need the domain in another place under Firewall to enable loading of script in editor?

Thanks for you help.
JonathanFS

Hi Jonathan,

I have had a play with the widget now to help give some better context.

Yes to avoid the error in page editor, the script will be attempting to run the Google charts still, therefore you would need the same firewall in the “Build” firewall profile to avoid.

This being said, as it is in Build and there would be no record data to render, it would show as a blank widget. A common issue with custom widgets, they normally have a specific purpose and therefore are not functional or you dont want them to be function in Build studio.

In main.js (and the earlier error), the return data of get_template_data contains env: mats.environment().
Replace this with cs.context().sphere to remove the error. As this is bound to env and passed to the front end, you could then use this in main.htm as an example.

A good practice with this for widgets like this is to either bind the functionality to only work on interfaces or similarly if they are there to do and not be seen, show something in Build studio only so they do not look like a blank widget that might accidentally get mopped up in any housekeeping by someone. For example, including in main.htm an extra line such as the following:

<div v-if="env ==='build'">This is the Organisation chart widget</div>

This would then show, in page builder only:

image

You could take this further, using the same principles, to push settings through too so you could visualise subsets applied, relations selected, fields chosen on the widget display, in build studio only.

Hope this helps.

Carl

1 Like

That’s fantastic guidance Carl.

I have made all those changes and I’m getting no errors and widget looks great in *build.

Once final question related to setup of the widget to show my managers team

I have 2 Org Chart widgets on this page

  1. My Staff which has a base object of “Logged In User” and works perfectly.
  1. My Peers which has a base object of “Independent Object: User” and a Top Level subset which has been hardcoded to my manager – this was great for testing chart.

However I need a way of setting up the widget so it traverses from the Logged In User to Manager and then charts that, same as already but not from an Independent object as now.

I’ve tried various combinations of Base object and Relation to Lower Level but cant seem to figure out the correct config required.

Thanks
JonathanFS

Hi Jonathan,

So if I am understanding it right, you need a visual for “My Team” from your manager down.

To achieve this, base your widget at “Logged In User” M:1 Manager.

You then configure the settings as though you are representing from the manager perspective in the same way you have “My Staff”.

Independent objects will represent “all records” but without a focus record will not function. Your subset is limiting to just the 1 but the config defined above will get you to show your managers team.

Carl

Hi Carl,

I tried that initially and it shows the same top level element (e.g Me)…

So the one on the right has its base object set to Logged In User and Relation to Lower Level is Base Object1:M Users (Managed) and this works as expected.

And the one on the left has its base object set to Logged In User and Widget Path is M:1 User (Manager) and Relation to Lower Level is 1:M Users (Managed) but this still returns the same chart as shown…?

New base setup where I want to display Managers Team.

…it seems the code must be using the Base Object and excluding the widget path, or I have set it up wrong.

Appreciate the expert help I’m getting.
Thanks
JonathanFS

Hi Jonathan,

You are right, there does seem to be an issue. I am just playing with some solutions so please hold tight!

Lesson learned, have more and better test data in my sandbox… I missed an obvious spot.

I have tweaked the main.js on my version from line 65 and can see a manager now with my recommended setup as you have it -

return {
	get_template_data: function() { 
		//let rr = widget.get_root_record_id();
		let rr = widget.get_base_record_id();

There does seem to be other use cases I can think of like a total org chart doesnt seem to render anything so I will look for a soution to this. My initial tests I dont seem to have broken anything with this 1 change…

Carl

1 Like

Hi Jonathan,

I can confirm my fix above does the trick.

Looking at the code, a whole organisation tree isn’t technically a thing as the subset restriction is what allows that to kick in. I tried to get it working without a subset but some of the recursion through the relationships doesn’t quite work so would take some more time. Assume this isnt an immediate requirement?

Carl

1 Like

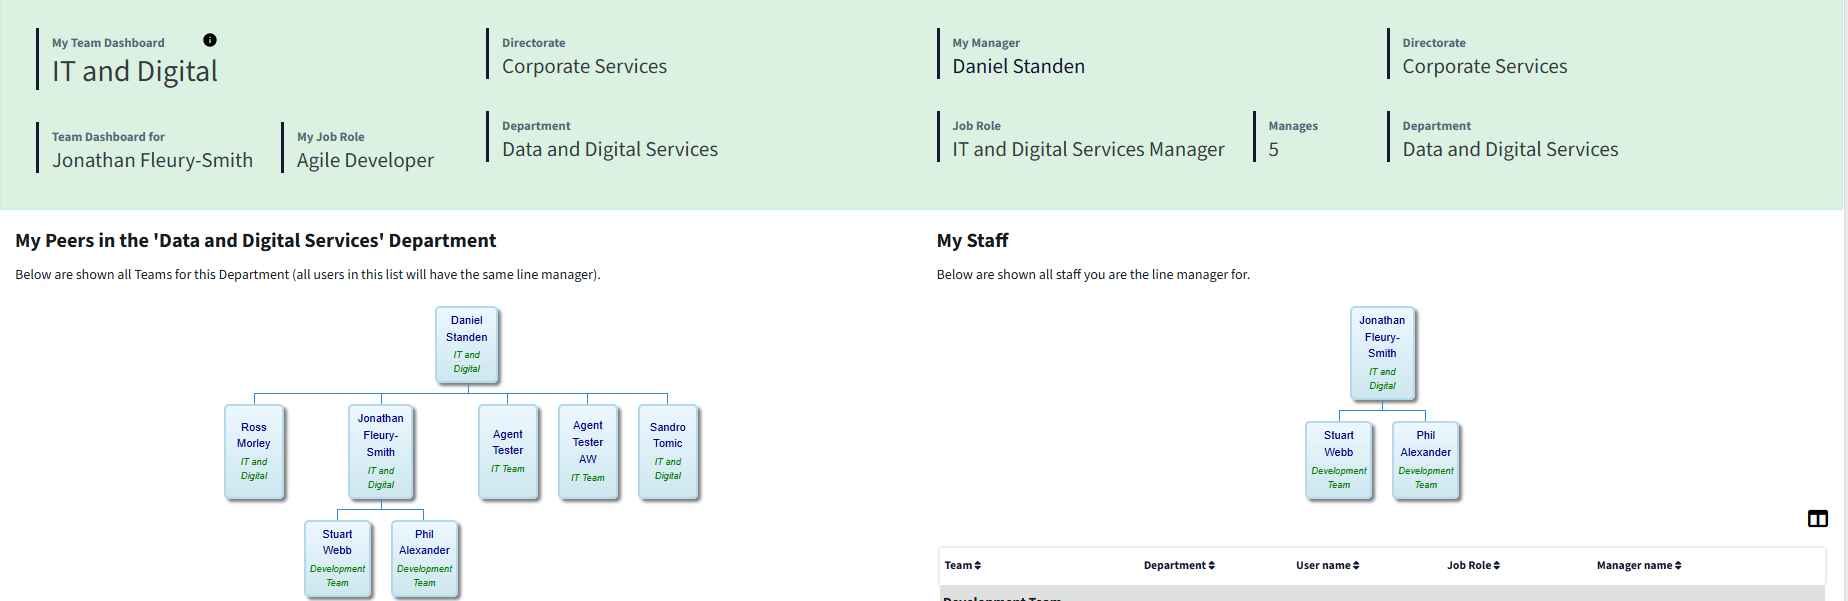
I have added a max depth setting to widget so I can set a limit on recursion depth, and a highlight of current user.

I am also going to look at seeing if I can change the chart to left to right, not top to bottom as now also.

Many Thanks, I appreciate your expert help.

Here is code for anyone interested in the updated widget.

/* Main server-side widget codes*/

/*
Function: 	format_name(r, highlight_user_id)
Overview: 	Generates a formatted HTML snippet representing a single record (e.g., a person or item) for display in the chart. It includes the name, 
			optional image, job role, team, and styling for highlighted users.
*/
function format_name(r, highlight_user_id) {
    let fp = widget.get_setting("name_field"); // Get the field path for the name
    let n = r.get(fp, "displayable"); // Retrieve the displayable name from the record

    let imf = widget.get_setting("image_field"); // Get the field path for the image
    let im_img = ""; // Initialize image HTML string
    let img_size = "64px"; // Default image size
    let chart_size = widget.get_setting("chart_size"); // Get chart size setting
    if (chart_size === 'medium') img_size = "48px"; // Adjust image size for medium chart
    if (chart_size === 'small') img_size = "32px"; // Adjust image size for small chart
    if (imf != null) { // If image field is defined
        let img = r.get(imf); // Get image file reference
        if (img != 0) { // If image exists
            let url = cs.record_field_file_url(img); // Get image URL
            im_img = '<img src="' + url + '" style="width: 100%; height: 100%; max-width: ' + img_size + '; max-height: ' + img_size + ';" alt="image">'; // Build image HTML
        }
    }

    let sfv = ""; // Initialize secondary field value (e.g. job title)
    let fs = widget.get_setting("secondary_field"); // Get secondary field path
    if (fs !== null) sfv = r.get(fs, "displayable"); // Retrieve displayable value

    let tfv = ""; // Initialize third field value (e.g. team)
    let ft = widget.get_setting("third_field"); // Get third field path
    if (ft !== null) tfv = r.get(ft, "displayable"); // Retrieve displayable value

    let tmw = widget.get_setting("tile_min_width"); // Get tile minimum width setting
    let name_entry = {}; // Initialize chart entry object
    name_entry.v = '' + r[':id']; // Set entry ID as string

    let content = ''; // Initialize content HTML
    if (im_img.length > 0) content += im_img; // Add image if available

    content += '<div style="color:black; line-height: 0.8em;"><strong>' + n + '</strong></div>'; // Add name to content
    if (sfv && sfv.length > 0) {
        content += '<div style="color:black; font-size:smaller; line-height: 0.8em;">' + sfv + '</div>'; // Add job role if available
    }
    if (tfv && sfv.length > 0) {
        content += '<div style="color:black; font-style:italic; font-size: 75%; line-height: 0.8em;">' + tfv + '</div>'; // Add team info if available
    }

    let is_highlighted = ('' + r[':id'] === '' + highlight_user_id); // Check if current record is highlighted
    let highlight_style = is_highlighted
        ? 'background-color: #ffffff ; border: 2px solid #E6C34A; padding: 4px; border-radius: 6px; margin: -4px; font-size:1.25em; font-weight:bold; color:black;' // Style for highlighted entry
        : ''; // No style if not highlighted

    if (tmw !== null) {
        name_entry.f = '<div style="line-height: 0.8em; min-width: '+tmw+'px; ' + highlight_style + '">' + content + '</div>'; // Add content with min-width
    } else {
        name_entry.f = '<div style="line-height: 0.8em; ' + highlight_style + '">' + content + '</div>'; // Add content without min-width
    }

    return name_entry; // Return formatted chart entry
}


/*
Function:	add_row(mid, rid, rows, highlight_user_id, depth = 0, max_depth = 4)
Overview:	This function recursively builds a hierarchical data structure for a chart by traversing related records. It starts from a given 
			record ID (rid), formats it for display, and adds it to the rows array. It then follows a configured relationship path to add child records, 
			continuing until a maximum recursion depth is reached.
*/
function add_row(mid, rid, rows, highlight_user_id, depth = 0, max_depth = 4) {
    if (depth >= max_depth) return; // Stop recursion if max depth reached
    if (rid < 0) return; // Skip invalid record IDs

    let r = cs.record(rid); // Get record by ID
    let ss = widget.get_setting("subset"); // Get subset setting
    if (ss != null && !r.in_subset(ss)) return; // Skip if record not in subset

    if (r !== null) {
        rows.push([format_name(r, highlight_user_id), mid]); // Add formatted entry to rows

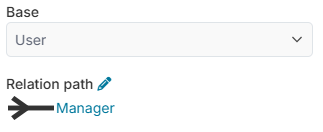
        let rp = widget.get_setting("relation_path"); // Get relation path setting
        if (rp !== null) {
            let rs = r.get_related(rp); // Get related records
            for (let x = 0; x < rs.length; x++) {
                add_row('' + r[':id'], rs[x][':id'], rows, highlight_user_id, depth + 1, max_depth); // Recursively add related records with incremented depth
            }
        }
    }
}


return {
	get_template_data: function() { 
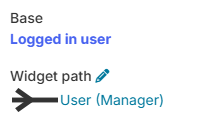
		let current_user_id = cs.get_session_user_id(); // Get current user ID to highlight them

		let max_depth = widget.get_setting("max_recursion_depth") || 3; // Get max recursion depth from settings, default to 3

		let rr = widget.get_base_record_id(); // Get base record ID

		let rows = []; // Initialize rows array
		if (rr !== null && rr > 0) {
			add_row(null, rr, rows, current_user_id, 0, max_depth); // Add base record and its children
		} else {
			if (widget.get_root_object_id() != null) {
				let opts = {
					'base_object_id': widget.get_root_object_id(),
					'selects' : [':id']
				}; // Search options
				let ss = widget.get_setting("top_subset"); // Get top subset setting
				var results = mats.search(opts); // Perform search
				for (let i = 0; i < results.length; i++) {
					if (results[i].in_subset(ss))  
						add_row(widget.get_setting("root_label"), results[i][':id'], rows, current_user_id, 0, max_depth); // Add top-level entries
				}
			}
		}

		let widget_id = "chart_" + Math.floor(Math.random() * Math.floor(10000000)) + "div"; // Generate unique widget ID

		return {
			chart_size: widget.get_setting("chart_size"), // Chart size
			div_id: widget_id, 					// Widget container ID
			data_rows: rows, 					// Chart data
			env: cs.context().sphere, 			// Environment context
			name: widget.name, 					// Widget name
			message:'', 						// Optional message
			highlight_user_id: current_user_id	// Highlighted user ID
		} 
	}

}

Thank you for your update and your updated code, especially all the comments is very helpful.

Will be sure to review this in line with the widget on the AppShare and an updated version put out to the world.

Not sure the Google Charts used here supports left to right, at least from a quick bit of looking up, but if you find a solution to this, please do feed back.

Glad it is all working for you now, been a pleasure supporting.

Carl