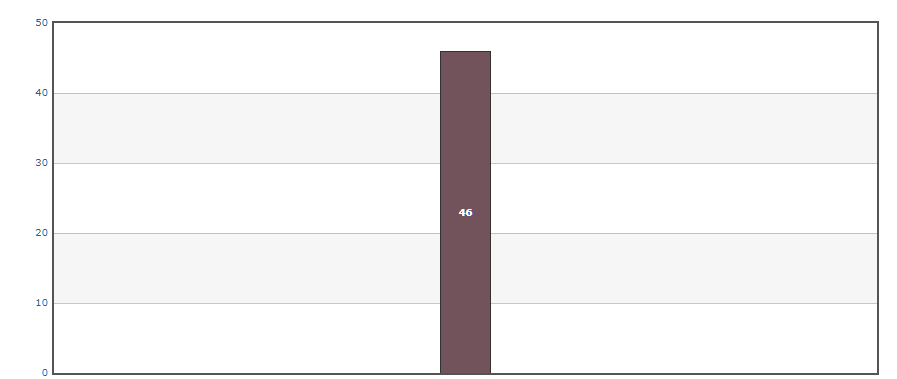
I would like to create a bar chart that shows:
- Users
- How many requests they created
I can see that 46 is the total amount of requests.
But need to see it by user, I use the ‘user’ object but it only shows 1 user.
Anyone able to post a screenshot of ‘Chart basics’ settings?
