Hi guys,
I hope you’re all having a good week.
I just had a quick question and I thought I’d see whether anyone knew any easy answer before doing loads of extra investigation.
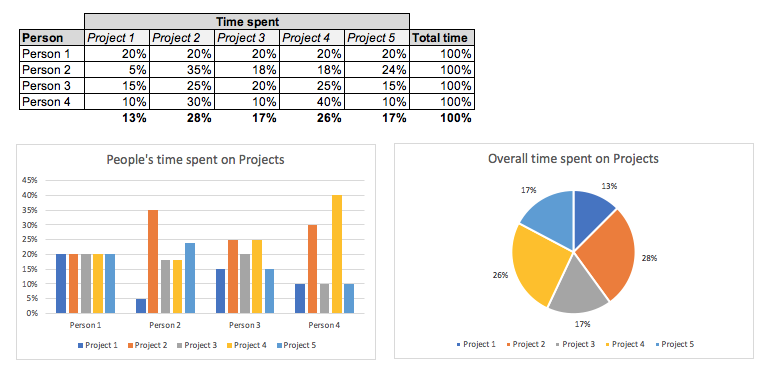
What I’m wondering is… is there an easy way to create a data table that takes information from different questions and can do calculations with it? Also, is there an easy way to create charts (e.g. bar charts) from these tables?
For example:
(apologies it it hasn’t loaded, I was having some issues, potentially with file type but it tried .png, .jpg and .jpeg)
I’ve been playing around with different bits and pieces (e.g. composites and pivots) but I’m not sure whether this needs deeper tech to sort.
Any help or thoughts would be much appreciated.
All the best,
Dave
Thanks for the query @Dave.Downes. I’ll get one of our experts to take a look at this ASAP.
Cheers, Tony
Hi Dave,
This could be quite an involved answer to give via the Community and will depend on the data structure within your application. Composites and pivot tables will definitely be needed.
As charts require record data as input, you might find utilising an object as a cache of the data to display on charts is an approach to consider?
If you’d like a discussion on the phone with one of our builders to consider different approaches please let us know,
Richard
Excellent, thanks @tony.norman
Hi Richard,
Thanks very much for the quick response. Please could I take you up on your offer of speaking to one of the MATS Builders please? I’m quite new to the system so it will probably need quite a bit of explaining to me.
All the best,
Dave
Hi Dave,
Yeah no problem, i’ll DM you now to get the best contact information.
Richard