I have a graph with several layers of drill-down. At the end of the drill-down I would like to inspect the records underlying the values in the graph. Is there any way to be able to select to list the records that comprise the graph?
I am aware that you are able to select to display the graph as a table, but that only gives a summary of the graph values (e.g. total of for 4 grouping A and 5 for grouping B), whereas I would like to get a full list of the records - which in my example would be 9 records.
While creating an accelerator for the community (Who’s On - COVID19), I wanted to achieve the similar functionality. I created a ‘Stacked Column’ chart with many layers of drill-down and wanted to have a ‘filtered’ list of records when the user clicks on a specific segments of it.
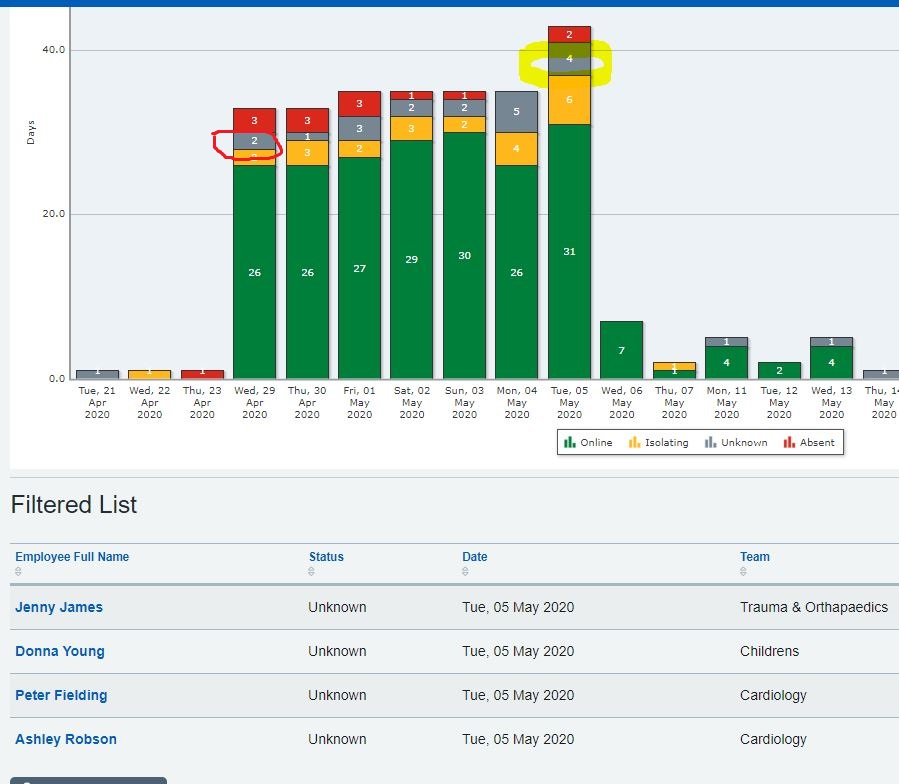
Attached is a screenshot to show how I achieved it.
.
If a user clicks the segment with 4 records (the one highlighted yellow), the list trims down to show only those 4 records. Next if the user clicks another same coloured segment (the one highlighted in red), list at the bottom ‘adds’ those 2 records and shows a total of six. Both the Chart and the List have same base object and they don’t have to be in a Widget Group.
1 Like
That is exactly what I need!
One thing I am not sure of is - how do you get the Filtered List to take its contents from the graph?
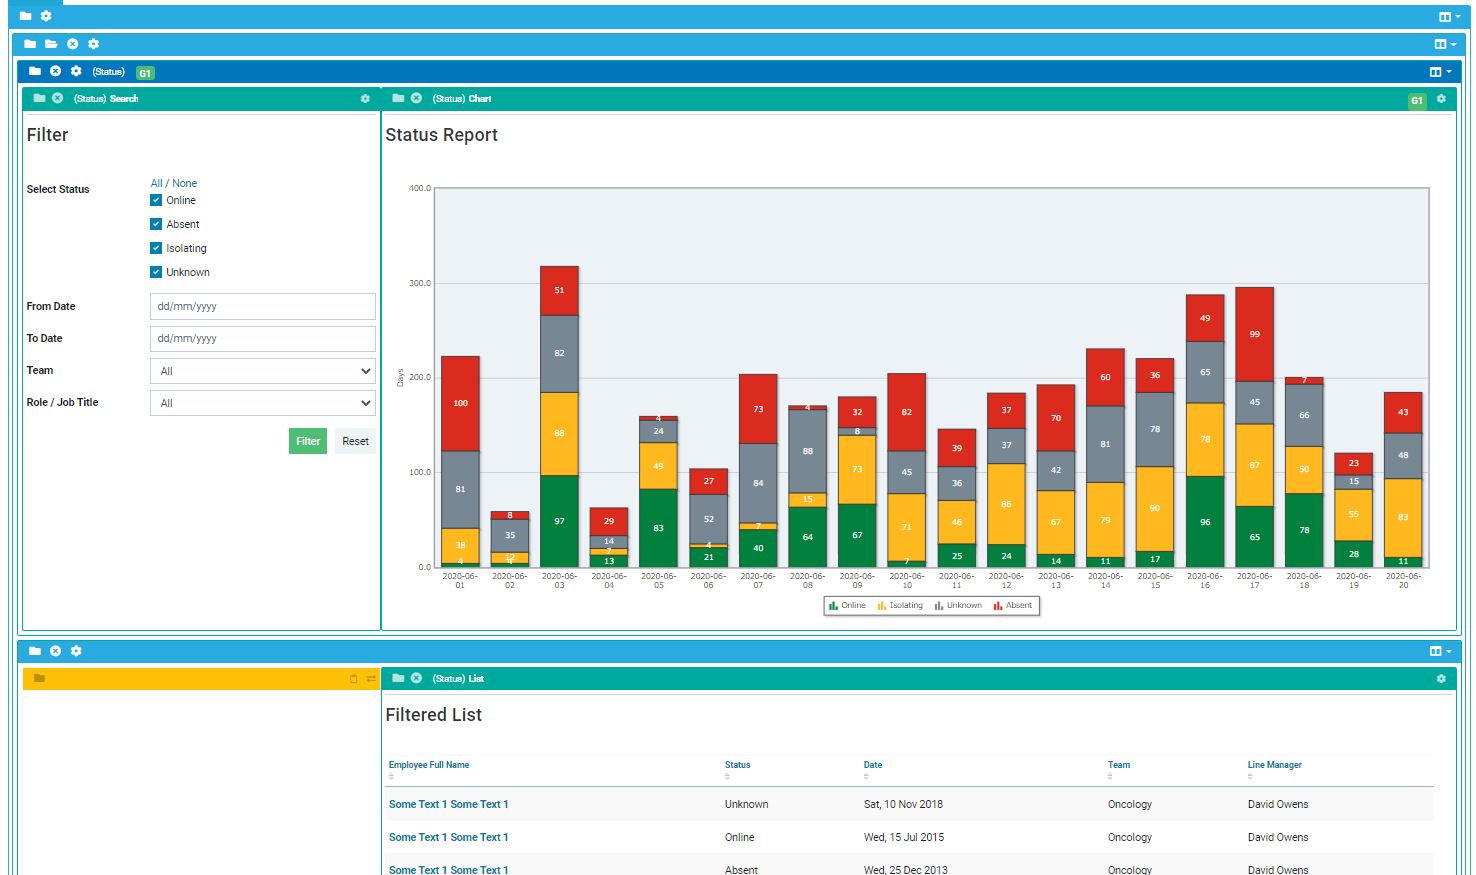
The way it worked for me was I put a search widget and a chart in one Widget Group, and kept my list widget out of it. There was no need to ‘create’ a link as such between the graph and list. Please check the screenshot.
If you prefer you can download this accelerator for a more detailed look using the following link: https://community.netcall.com/appshare/covid-19-whos-on/