Hi all,
One of our groups has told us that the Liberty Converse Queue Summary report seems to average the SLA percentages of the individual queues rather than calculating an SLA based on all the calls. Is this correct and if so is there a way for us to easily see to total SLA and not an average of the queue’s SLAs?
Thanks,
Daniel
Hi @DanielWhite1 This can depend on what you determine as the Total SLA.
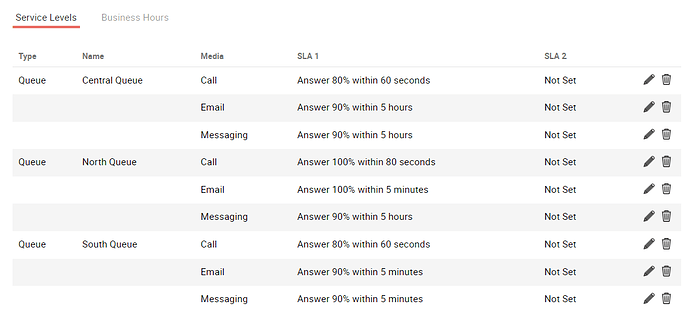
The Queue Summary report will display the SLA set within your Contact Centre SLA Settings
An example of these are here. I have set these to individual Queues, so I can report on them separately.
I can also Add A Group SLA to show all the Queues as a whole, but this is not really the best way to do things.
The Queue Summary report has the following columns for Call Interaction SLA’s
- Call Queue SLA1 Within SLA - Number of calls that met the Queue SLA1 target
- Call Queue SLA1 Over SLA - Number of calls that missed the Queue SLA1 target
- Call Queue SLA1 % - Calls that met Queue SLA1 expressed as a percentage of total calls (within and over Queue SLA1)
- Call Queue SLA1 Target % - Queue SLA1 target percentage set by the organisation
- Call Queue SLA2 Within SLA - Number of calls that met the Queue SLA2 target
- Call Queue SLA2 Over SLA - Number of calls that missed the Queue SLA2 target
- Call Queue SLA2 % - Calls that met Queue SLA2 expressed as a percentage of total calls (within and over Queue SLA2)
- Call Queue SLA2 Target % - Queue SLA2 target percentage set by the organisation
These will show you the number of calls within and Over your SLA set for the time period you have chosen and the % of calls that fit into each of these categories.
This should be showing you the number and not an average. So if you have an example that would be really helpful (if posting, please blank out any personally identifiable data),
Secondly you also have the SLA Report that can show you information about your SLA’s. There is more on this in our Documents portal under our reports section : https://docs.netcall.com/docs/liberty-converse/5.9/supervisor-guide/reporting-library/service-level
Let us know if you feel it is an average and not a total, and if so, please can you provide a screenshot/data.
Many thanks.
Jonathan
Thanks @JonathanRedsell,
This is how we have SLA set for this group:
In terms of what we are seeing, for an example day (20/6/23) when manually calculating the group’s SLA via an Interactions report we see 1388 out of 1720 calls answered within 65 seconds so 80.70%. Yet the Queue Summary report is showing a total SLA of 83%.
I can provide the data for this, but would it be better if I logged this via the support portal?
HI Thanks Daniel, in your Interactions report did you take into consideration any CallBacks and Outbound Calls? If you take these out, does that bring the figure up to the 83% the SLA shows within the Queue Summary report?
Thanks Jonathan.
I have checked and the interactions report does not include any call backs or outbound calls. However, when I have delved a little further I have noticed that if I total up calls answered, abandoned or redirected within 65 seconds I get 1431 which is 83.2% matching the Queue Summary total of 83%.
What is the formula being used to calculate SLA on the Queue Summary report?
Sorry, should have done some searching first. Found:
Help Portal (netcall.com)
and using that formula I get 82.7%. However, I can see the group are treating all abandoned and redirected as failures.

